2nd ORGANIZER OF MAP LINKS
In the Layer Organizer, you can activate and deactivate the layers displayed in the map field and display their legend.

CATEGORIZATION OF MAP LAYERS
Map layers are divided into four basic groups in the application, and these can be further divided into thematic groups (for example, into passport layers).
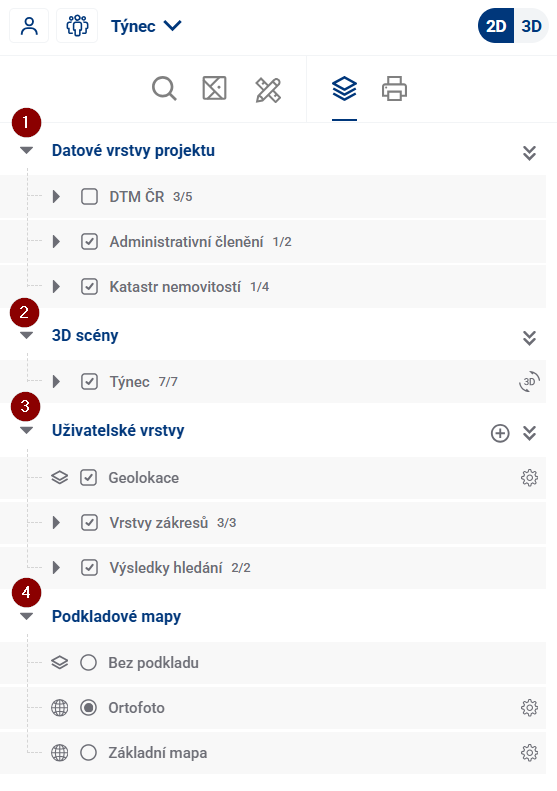
ACTIVATE/DEACTIVATE LAYERS
- click on the check mark next to the layer name to activate/deactivate the selected layer in the map
- when activated, the parent groups are activated at the same time
- deactivation has no effect on the parent groups
- clicking on the checkmark next to the layer group name activates/deactivates the selected group in the map, which affects the visibility of subordinate layers
- by clicking on the check mark together with the CTRL key next to the layer group name, the subordinate elements in the lower levels are activated/deactivated in the map at the same time
- click on the checkbox next to the text Project data layers to activate/deactivate all connected data layers
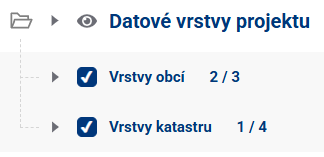
- if the group is collapsed, an indicator appears showing how many child elements are active and how many are deactivated
QUESTIONING IN THE MAP
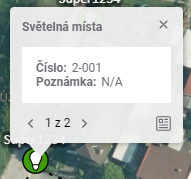
Some Data and User Layers can be queried by clicking into the map, which loads the attributes of the data layers into the Popup. This allows the user to easily find out all the details of the queryable layers at the point where they click. If there are multiple elements at a location, it is possible to scroll between them in the popup window.
the Popup window offers, besides the attributes of the item in question, also a button to go to the form and the possibility to copy the coordinates of the click point to the clipboard.
Layer pollability depends, among other things, on the visibility of the layer. It is not possible to click into the map to query elements of a layer that is disabled or invisible at the current zoom level.
LEGEND AND SETTINGS
Most layers have a legend with the symbols used and additional tools for zooming, navigating to the table and setting transparency. The legend makes it easier to identify elements in the map field. The user displays it by using the  button next to the layer.
A single layer can have multiple symbologies and categories within the symbology that can be independently turned on and off, similar to layers and layer groups.
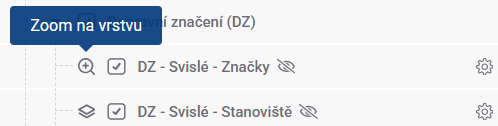
The “Zoom to Layer” tool zooms the map window so that all elements of the layer are visible. At the same time, the other layers will be temporarily muted to make the zoomed layer stand out better
You can quickly zoom into the layer range without opening the settings by hovering over the map base symbol next to the layer name
The “Go to table” tool redirects the user to the table of elements in the “Table data” module.
The “Transparency Settings” tool changes the transparency of the layer using a slider.